Short answer
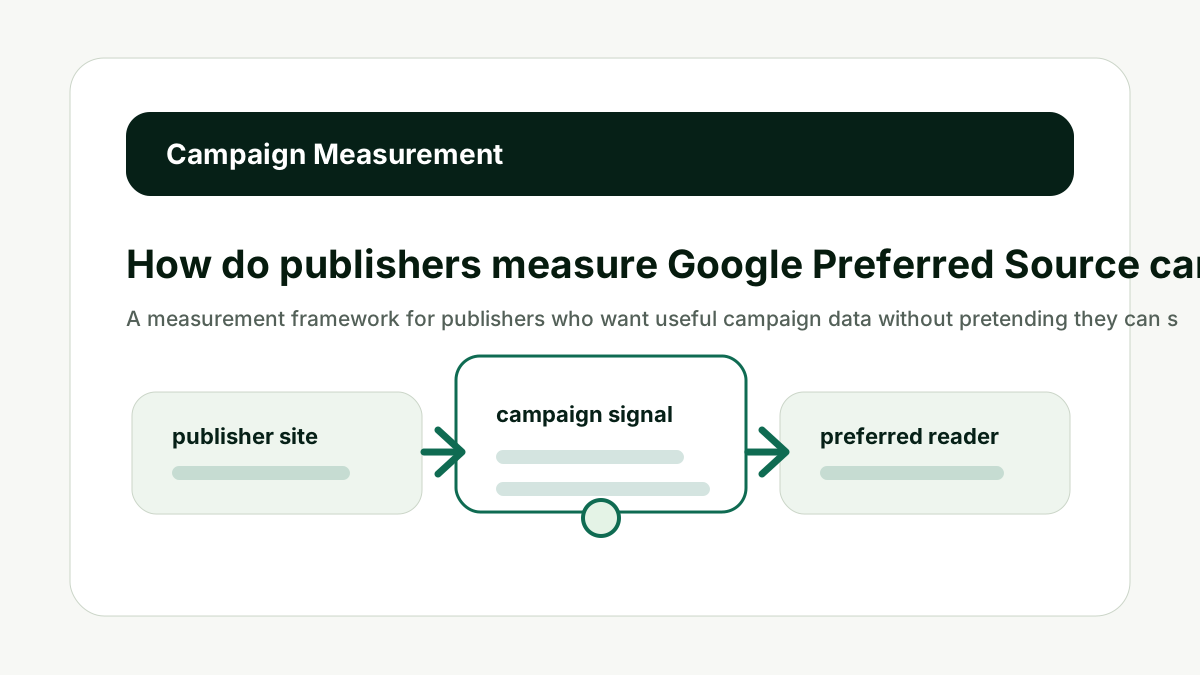
Measure a Google Preferred Source campaign by tracking the clicks you control, segmenting placements, recording campaign timing, and separately sampling Google visibility for selected-user scenarios. Do not treat CTA clicks as confirmed source selections, and do not treat selected-user visibility as normal ranking movement.
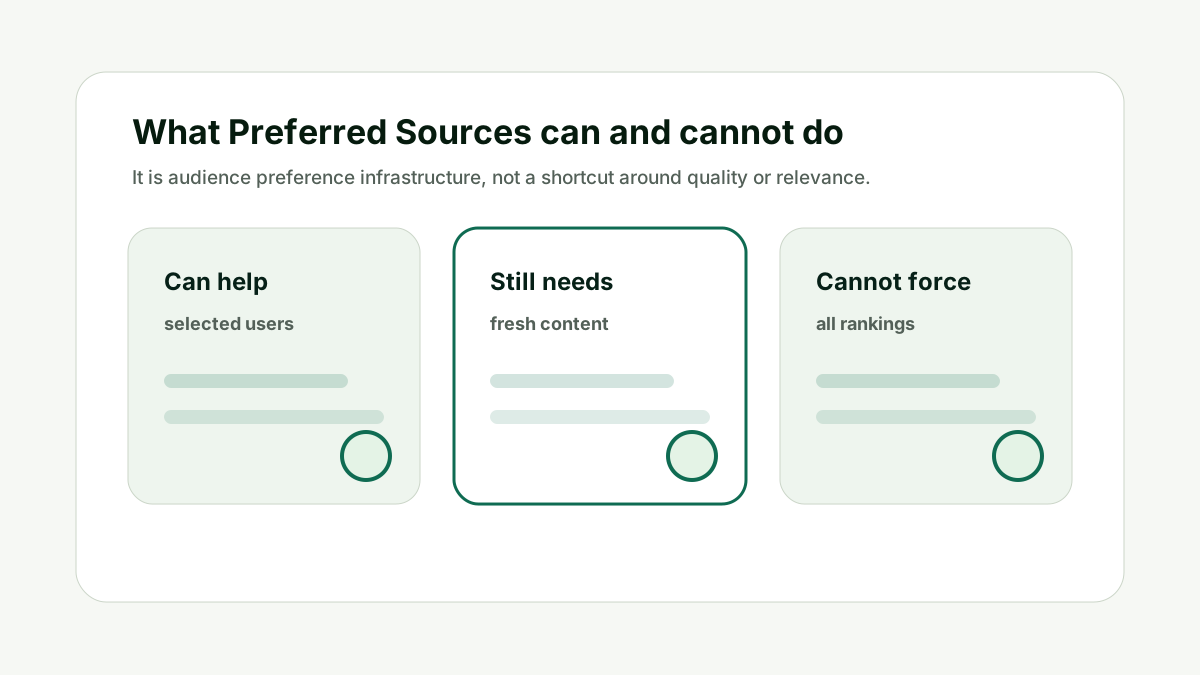
Google's own publisher guidance frames this as a way to help readers select a site they want to see more often in eligible Search surfaces. That is useful, but it still depends on user choice, relevant content, and the eligible Google experience.
For the platform details, use Google's Search Central preferred sources guide and Google's Preferred Sources announcement as the source of truth.
Reader question
"What should the report include?"
Use the Google Preferred Source Generator to standardize the campaign link and CTA, then build a simple measurement sheet with placement, clicks, channel, dates, and follow-up visibility samples.
Table of Contents
I am going to answer this as a publisher workflow, not as a magic search lever.
The useful question is not only whether a Preferred Source button exists. The better question is whether the button appears at a moment when the reader already trusts the source and understands the benefit.
Here is the framework I would use for a publisher has launched Preferred Source CTAs and needs to explain performance without misleading stakeholders.
Track CTA Clicks
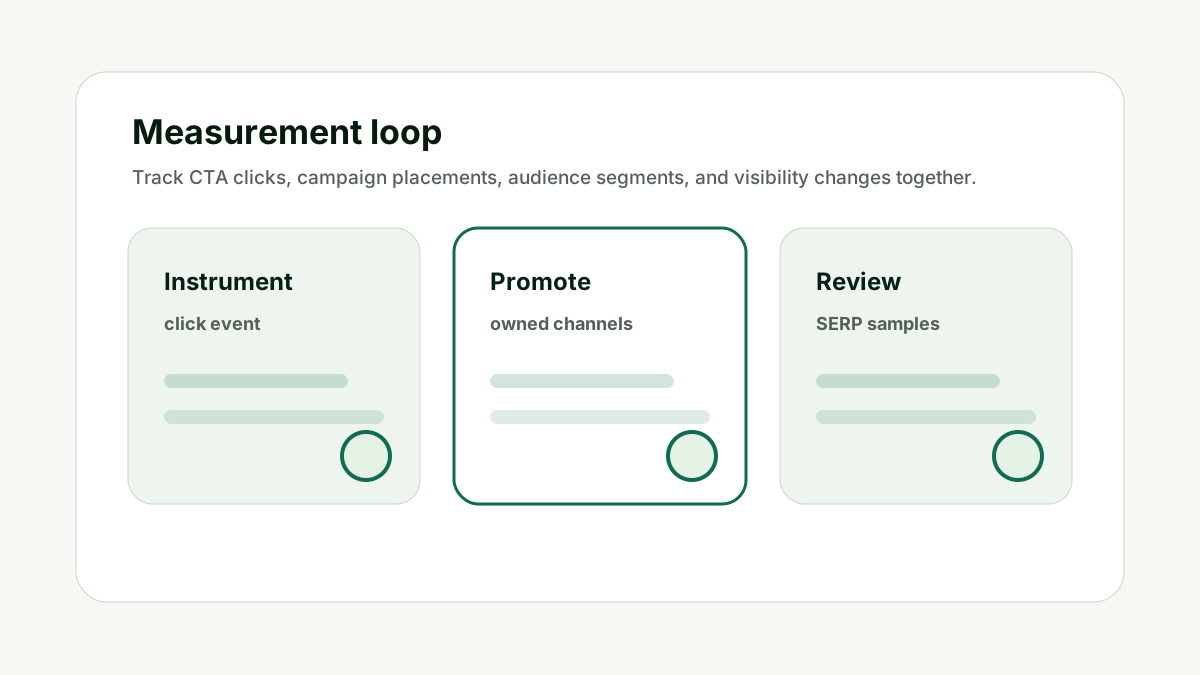
For How do publishers measure Google Preferred Source campaigns?, track cta clicks matters because your site can measure the reader clicking the CTA before they leave for Google. This is not just a button decision. It affects how much friction the reader feels, how clearly the campaign can be explained, and how honestly your team can report the result.
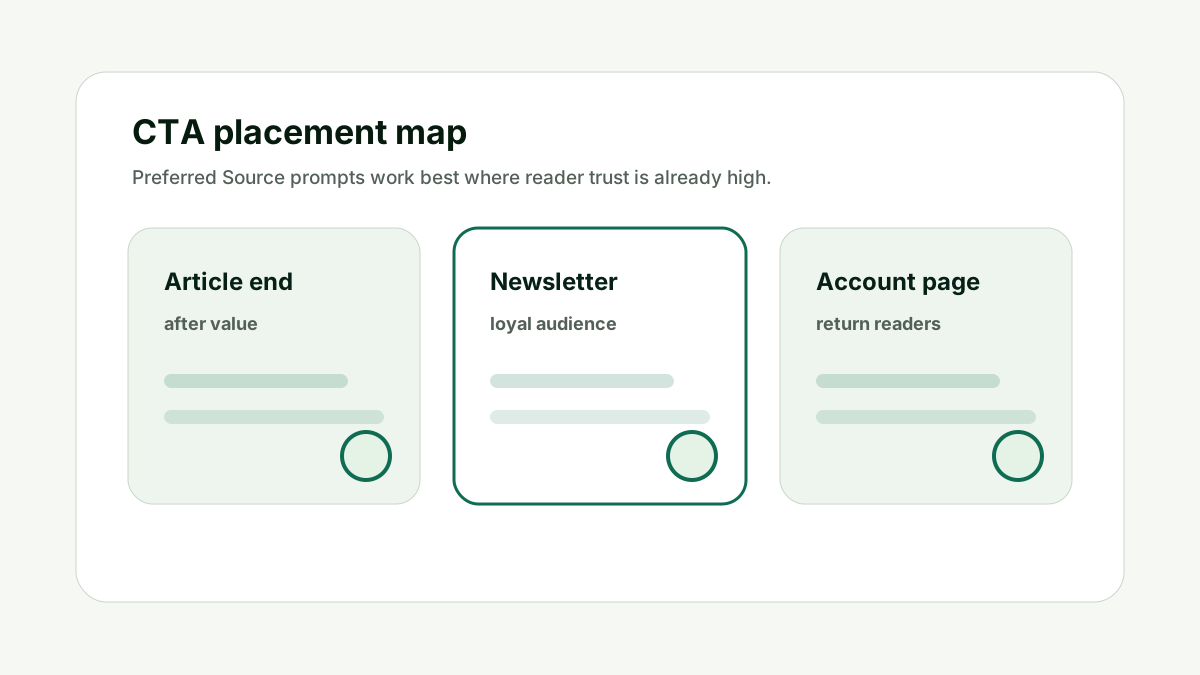
Set an event for each placement: article ending, newsletter, subscriber onboarding, social landing page, or topical hub. This tells you where readers showed intent.
Do not call every click a completed Google preference selection. Preferred Sources work best when the ask is specific, the page has already earned trust, and the reader can understand the action before leaving your site.
The practical test is simple: if a loyal reader saw this CTA out of context, would they know what they are adding, why it benefits them, and why your publication deserves that preference? If the answer is no, tighten the page, the copy, or the placement before scaling the campaign.
Track CTA Clicks is one of the practical decisions that makes a Preferred Source campaign easier to trust and measure.
Segment Placements
For How do publishers measure Google Preferred Source campaigns?, segment placements matters because placement context often matters more than total impressions. This is not just a button decision. It affects how much friction the reader feels, how clearly the campaign can be explained, and how honestly your team can report the result.
A low-volume subscriber page may have a higher click rate than a high-volume article template. Keep placement-level reporting so useful surfaces do not get hidden by aggregate numbers.
Do not average every CTA together if the reader context is different. Preferred Sources work best when the ask is specific, the page has already earned trust, and the reader can understand the action before leaving your site.
The practical test is simple: if a loyal reader saw this CTA out of context, would they know what they are adding, why it benefits them, and why your publication deserves that preference? If the answer is no, tighten the page, the copy, or the placement before scaling the campaign.
Segment Placements is one of the practical decisions that makes a Preferred Source campaign easier to trust and measure.
Record Campaign Timing
For How do publishers measure Google Preferred Source campaigns?, record campaign timing matters because Preferred Source campaigns are often promoted through newsletters, social posts, and article templates at different times. This is not just a button decision. It affects how much friction the reader feels, how clearly the campaign can be explained, and how honestly your team can report the result.
Keep a campaign log with launch dates, sends, template changes, and major stories. This helps you explain spikes and avoid misattributing normal news cycles to the button.
Do not compare weeks without noting whether a major story or newsletter send changed demand. Preferred Sources work best when the ask is specific, the page has already earned trust, and the reader can understand the action before leaving your site.
The practical test is simple: if a loyal reader saw this CTA out of context, would they know what they are adding, why it benefits them, and why your publication deserves that preference? If the answer is no, tighten the page, the copy, or the placement before scaling the campaign.
Record Campaign Timing is one of the practical decisions that makes a Preferred Source campaign easier to trust and measure.
Sample Visibility
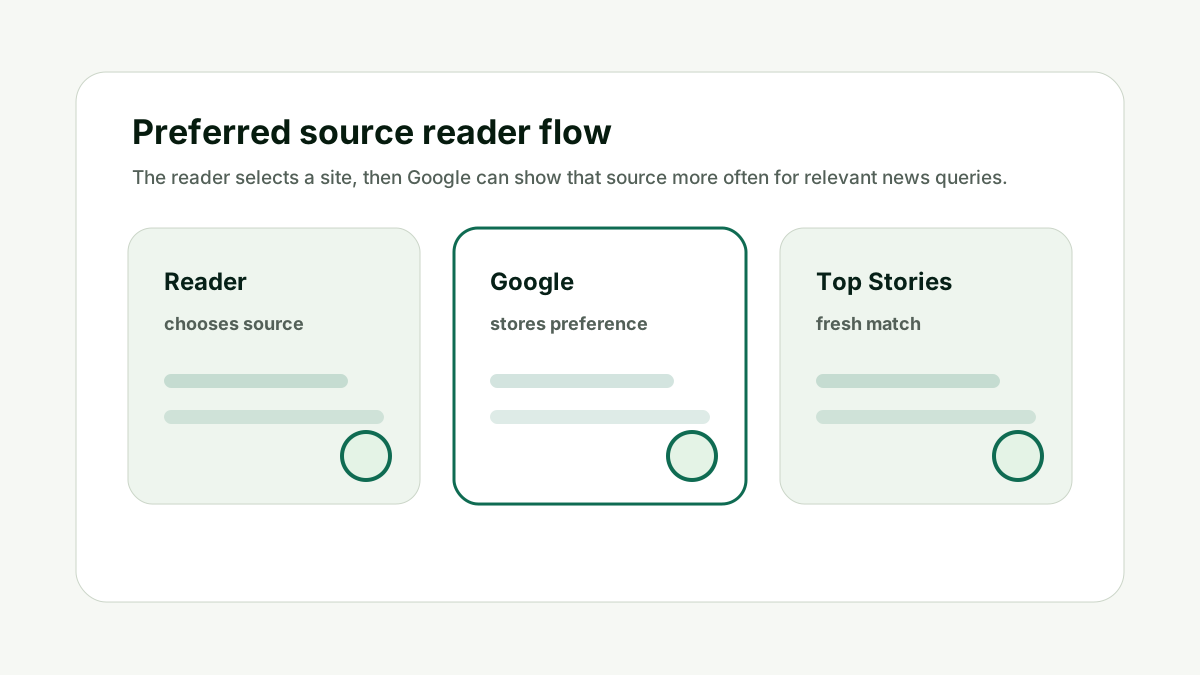
For How do publishers measure Google Preferred Source campaigns?, sample visibility matters because the search outcome depends on user selection, query relevance, freshness, and eligible Google surfaces. This is not just a button decision. It affects how much friction the reader feels, how clearly the campaign can be explained, and how honestly your team can report the result.
Use signed-in test accounts that selected the source to sample relevant news queries. Document screenshots, query, date, location, and whether Top Stories, From your sources, AI Mode, or AI Overview badges appear.
Do not mix selected-user screenshots with anonymous rank reports. Preferred Sources work best when the ask is specific, the page has already earned trust, and the reader can understand the action before leaving your site.
The practical test is simple: if a loyal reader saw this CTA out of context, would they know what they are adding, why it benefits them, and why your publication deserves that preference? If the answer is no, tighten the page, the copy, or the placement before scaling the campaign.
Sample Visibility is one of the practical decisions that makes a Preferred Source campaign easier to trust and measure.
Connect Quality Signals
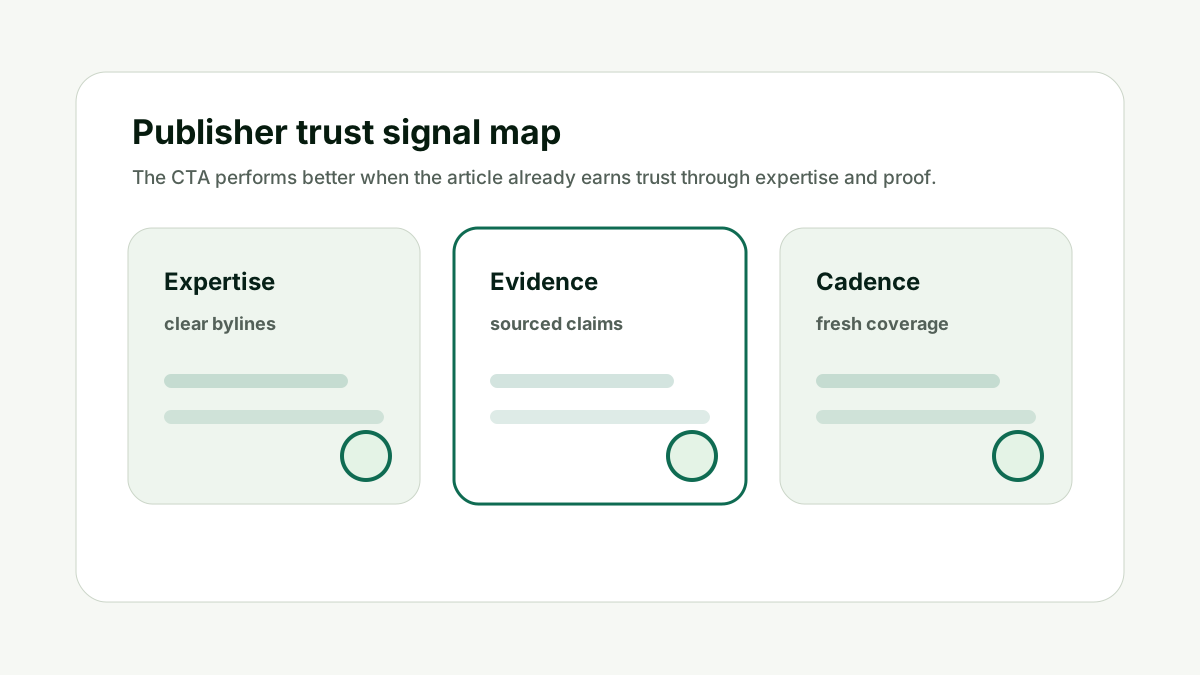
For How do publishers measure Google Preferred Source campaigns?, connect quality signals matters because if the articles are weak, stale, or poorly sourced, the campaign has less to work with. This is not just a button decision. It affects how much friction the reader feels, how clearly the campaign can be explained, and how honestly your team can report the result.
Use article-quality checks alongside campaign data. For AI-oriented visibility questions, LLMentioned can help identify whether the brand or publication is being surfaced in AI answers beyond the Preferred Source workflow.
Do not diagnose every weak result as a CTA problem if the article itself is not competitive. Preferred Sources work best when the ask is specific, the page has already earned trust, and the reader can understand the action before leaving your site.
The practical test is simple: if a loyal reader saw this CTA out of context, would they know what they are adding, why it benefits them, and why your publication deserves that preference? If the answer is no, tighten the page, the copy, or the placement before scaling the campaign.
Connect Quality Signals is one of the practical decisions that makes a Preferred Source campaign easier to trust and measure.
Report Carefully
For How do publishers measure Google Preferred Source campaigns?, report carefully matters because stakeholders need plain language that separates observed facts from interpretation. This is not just a button decision. It affects how much friction the reader feels, how clearly the campaign can be explained, and how honestly your team can report the result.
A good report says: "We generated 2,400 clicks to the source-preferences flow from three placements. Selected-user samples showed preferred-source visibility on four of eight fresh topical queries." That is precise and defensible.
Do not say "Preferred Sources increased rankings 40%" unless you have a separate methodology that actually proves that claim. Preferred Sources work best when the ask is specific, the page has already earned trust, and the reader can understand the action before leaving your site.
The practical test is simple: if a loyal reader saw this CTA out of context, would they know what they are adding, why it benefits them, and why your publication deserves that preference? If the answer is no, tighten the page, the copy, or the placement before scaling the campaign.
Report Carefully is one of the practical decisions that makes a Preferred Source campaign easier to trust and measure.
How This Fits the Wider SEO and AI Search Workflow
The important thing with How do publishers measure Google Preferred Source campaigns? is to treat Preferred Sources as audience infrastructure, not a shortcut around search quality. The real job is measuring the campaign as reader preference infrastructure rather than a ranking shortcut, while keeping classic SEO, article quality, and AI visibility work in their own lanes.
That order matters because a Preferred Source CTA can create reader intent only after the publication gives readers a reason to care. If the article is thin, stale, anonymous, or technically messy, the button is doing work the content should have done first.
I would use the generator as a production tool, not as the strategy itself. It helps create the deeplink, button, instructions, and copy variants. The strategic work is choosing the audience, the pages, the channel, and the reporting language.
This is also where internal links should stay natural. A guide about source preference does not need ten unrelated links. It needs the next useful resource: the generator when the reader needs an asset, citation readiness when the page needs more proof, and LLMentioned when the question moves from Google preference into broader AI visibility.
Standardize the link and CTA first, then give each placement its own event name so the report can separate channels. After the CTA is live, review both the campaign data and the underlying content. A strong campaign asks readers to prefer a source they already trust. A weak campaign asks readers to compensate for unclear publishing.
The most durable outcome is not a one-time spike in clicks. It is a repeatable reader-preference system that supports fresh coverage, cleaner reporting, and a stronger relationship between the publication and the audience.
A Simple Worked Example
A publisher launches three Preferred Source placements: article endings, newsletter footers, and subscriber onboarding. In the first month, article endings drive 1,500 clicks, newsletters drive 600, and onboarding drives 90.
The raw totals make article endings look best. But the onboarding click rate is much higher because every reader there has already taken a loyalty action. The team keeps the onboarding CTA even though it contributes fewer absolute clicks.
For search visibility, the team uses two signed-in test accounts that selected the publication and samples a small set of fresh queries twice per week. It records whether the publication appears in Top Stories, From your sources, or with a preferred badge where available.
The final report is useful because it does not overclaim. It shows reader intent, placement performance, and selected-user visibility samples as separate lines of evidence.
Practical action checklist
- Name each CTA event by placement.
- Track clicks, impressions, click rate, and campaign date.
- Keep newsletter, article, social, and onboarding data separate.
- Sample selected-user visibility with screenshots and query notes.
- Report what you observed and label anything else as interpretation.
What I Would Do Next
Create a simple measurement sheet before launching more placements.
Add selected-user SERP sampling to the report only when you can document the setup.
Use LLMentioned or AI visibility tools for broader answer-engine visibility questions.
Conclusion
How do publishers measure Google Preferred Source campaigns? is a useful question because it forces the publisher to separate reader preference, Google Search presentation, and broader SEO strategy.
The practical answer is to make the action easy, truthful, and measurable. Give readers a direct path, explain why the source is worth following, and report clicks separately from rankings.
That gives your team a cleaner campaign than a generic button with vague promises.
FAQ
Can Google Analytics show completed Preferred Source selections?
Your analytics can usually show CTA clicks from your site. The final selection happens on Google, so treat your data as click intent unless you have another verified signal.
Should I use UTMs on the Google deeplink?
Use campaign tracking on your own page and event tracking on the CTA. Be careful changing the source-preferences URL format beyond what Google documents.
How often should I sample visibility?
Weekly sampling is enough for many publishers. Increase cadence around major campaigns or breaking-news periods.
What is a good success metric?
Start with placement-level CTA clicks and click rate, then add selected-user visibility samples and repeat-reader engagement where available.

Adam O'neil
1stpage Editorial Team
Our 1stpage editorial team combines hands-on SEO agency experience with evidence-backed search performance guidance. These posts are built from real search wins, audit-grade insight, and conversion-tested tactics designed to help agencies, founders, and search teams earn more traffic and trust.